Optimize Grafana dashboards with Elasticsearch index aliases
December 20, 2018 grafana elasticsearch
Grafana is a very popular opensource dashboarding solution. Provides support for a long list of storage solutions, including Elasticsearch. Unfortunately, the ES support is not at the same level as the one you get for InfluxDB, for instance. Still, Grafana allows combining in the same dashboard different data sources. It is possible to have a panel fetching data from ES and a different panel fetching data from InfluxDB.
Grafana ❤️ Elasticsearch
Grafana provides stellar support for InfluxDB & Prometheus, among others. This means that you get, query autocompletion for fields, values, etc. When you select ES as a data source for a panel, the features are a bit less polished. You are greet by a “Lucene query” input and some more options. Depending on the metric (aggregation), Grafana also provides some help for field name selection when using ES as a data source.
Up to this point, everything is ok, Elasticsearch is not a first citizen in the Grafana ecosystem, but it’s supported and maintained). The issue that we had a few days ago (and that inspired the content of this post) was instead related to the query that Grafana sends to ES.
Let’s say that we want to calculate the average of a memcache field in a
specific index stored in ES. Only for a subset of our hosts (those that start
with www). Using a Lucene syntax we can “filter” to only a subset of the
hosts with the following query:
header.senderId:www*
We could put the same query in a Grafana panel, and we end up with something like this:

If we check the Query Inspector
we can see the query that Grafana sends to ES (actually to the proxy, but
this detail is not important). The relevant section is the
request.data attribute, that looks like:
{
  "size": 0,
  "query": {
    "bool": {
      "filter": [
        {
          "range": {
            "@timestamp": {
              "gte": "1544518226265",
              "lte": "1544539826265",
              "format": "epoch_millis"
            }
          }
        },
        {
          "query_string": {
            "analyze_wildcard": true,
            "query": "header.senderId:www*"
          }
        }
      ]
    }
  },
  "aggs": {
      "...": "...",
  }
}
We can see that Grafana is applying a
Filtered Query.
One small detail is that whatever we put in our “Lucene query” input field will
be placed in the query_string section, as an extra filter. This is
great for 90% of the queries, the problem is that if you’re querying a large
enough dataset (let’s say you want to aggregate over 19M documents), and you’re
applying a lot of filters (like searching for specific hosts). This can have an
impact on the performance of your query.
Not everything is bad if you’re using a time-based index pattern, and your Elasticsearch data source in Grafana is properly configured, Grafana will know to which indexes send the query depending on the time range, pretty cool!.
The problem
So far, we’ve talked only about how Grafana works. One of our users reported that from time to time a specific Grafana dashboard would be slow while fetching data from ES. We saw this issue in our internal monitoring as well:

This graph shows that approximately every hour we had a spike in the ES query time, spiking to ~7s. After some detective work, one coworker found the culprit dashboard. Considering that the query was executing periodically, it was a good bet that the query was coming from some sort of automated source (like a dashboard put in a rotation).
After identifying the problematic query we realized that the query was hitting a lot of unnecessary shards (last 30 days). We fix it by configuring the data source to use the daily pattern. This helped with reducing the number of shards that the query hit. Still, it didn’t impact significantly the response time of the query. This is a testimony of how efficient ES/Lucene is.
Time to profile
At this point, there is not a lot of things that we can do, except profiling the query. Kibana comes bundled with a Search Profiler with the basic version of X-pack. Putting the query in the profiler and hitting the Profile button already provided a lot of insight:

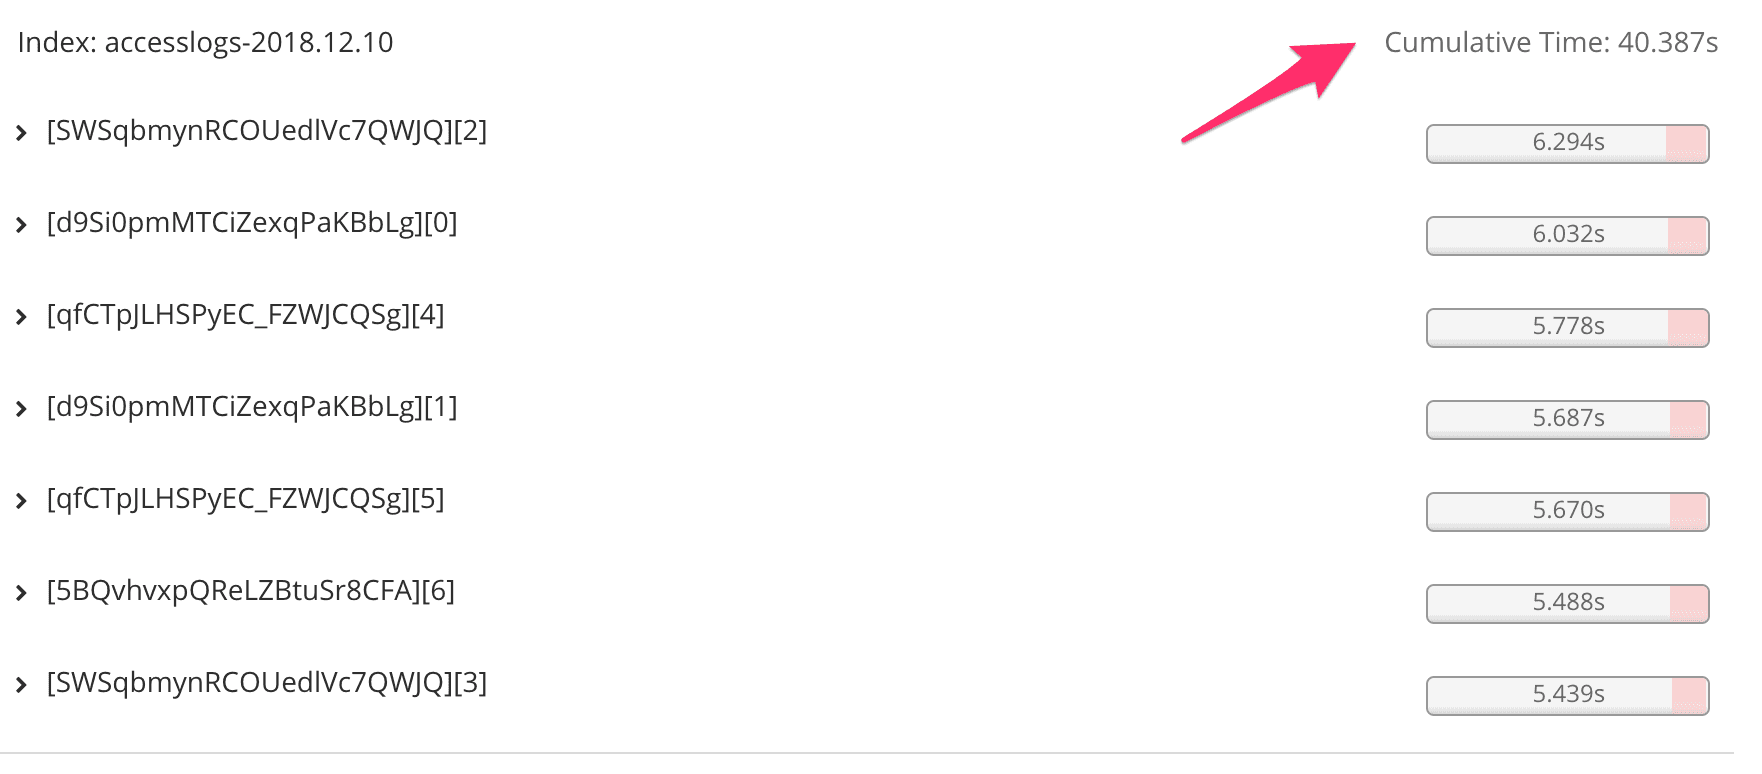
To reduce the noise introduced. we decided to query one specific index. For 1 day of data the query that Grafana was sending to ES was taking ~40s (inside the profiler). Of course, a significant part of this time comes from the profiling itself. We knew that on production for the last 2 days this time was ~7s. So we decided to use the 40s as a base reference.
The real query looked very similar to:
{
  "size": 0,
  "query": {
    "bool": {
      "filter": [
        {
          "range": {
            "@timestamp": {
              "gte": "1544315703107",
              "lte": "1544445303107",
              "format": "epoch_millis"
            }
          }
        },
        {
          "query_string": {
            "analyze_wildcard": true,
            "query": "(header.senderId:www1 OR header.senderId:www1 OR header.senderId:www2)"
          }
        }
      ]
    }
  }
  "...": "..."
}
The tricky section was that the host filter included over 30 servers
(hostnames). The original query also included a couple of more conditions that
we can disregard for the sake of this article. Of course, executing this over
19M documents it is expensive and time-consuming (even for ES). The
query_string is not very optimal for filtering data. If we look at the
“internal query” that ES will execute we see something like:
{
  "valid" : true,
  "explanations" : [
    {
      "index" : "accesslogs-2018.12.10",
      "valid" : true,
      "explanation" : "#@timestamp:[1544315703107 TO 1544445303107]
                      #(+(header.senderId:www1 header.senderId:www2 ... )"
    }
  ]
}
This means that internally ES will treat this as a boolean query and will execute that query against every document that falls in the time range. Even after Grafana selected the right indices to query, this was a lot of processing to do. Can we find a better way to write this query?
If we take the very long list of hosts and apply that as a must filter:
{
  "query": {
    "bool": {
      "filter": {
        "bool": {
          "must": [
            {
              "terms": {
                "header.senderId": [
                  "www1",
                  "www2",
                  ...
                ]
              }
            },
            {
              "range": {
                "@timestamp": {
                  "gte": "1544315703107",
                  "lte": "1544445303107",
                  "format": "epoch_millis"
                }
              }
            }
          ]
        }
      }
    }
  }
}
And check the internal query that ES will execute in the profiler:
"valid" : true,
  "explanations" : [
    {
      "index" : "accesslogs-2018.12.10",
      "valid" : true,
      "explanation" : "(ConstantScore(+
                      @timestamp:[1544315703107 TO 1544445303107]
                      +header.senderId:(www1 www2 ...)))^0.0"
    }
  ]
The explanation section is very different. First of all, we
see that when we use the filter everything is wrapped in ConstantScore,
meaning that no scoring will be performed (we just want to include/exclude data
based on certain criteria). Since the first query is a BooleanQuery for every
OR condition that we’ve in our query, ES will need to execute a TermQuery,
for each individual condition. But when using a filter, this goes down to a
TermInQuerySet, which means that we save some processing time.
The other benefit of using filters is that the result set (document ids) will be cached. This is even more important if you’ve several Grafana panels that apply the same filters.
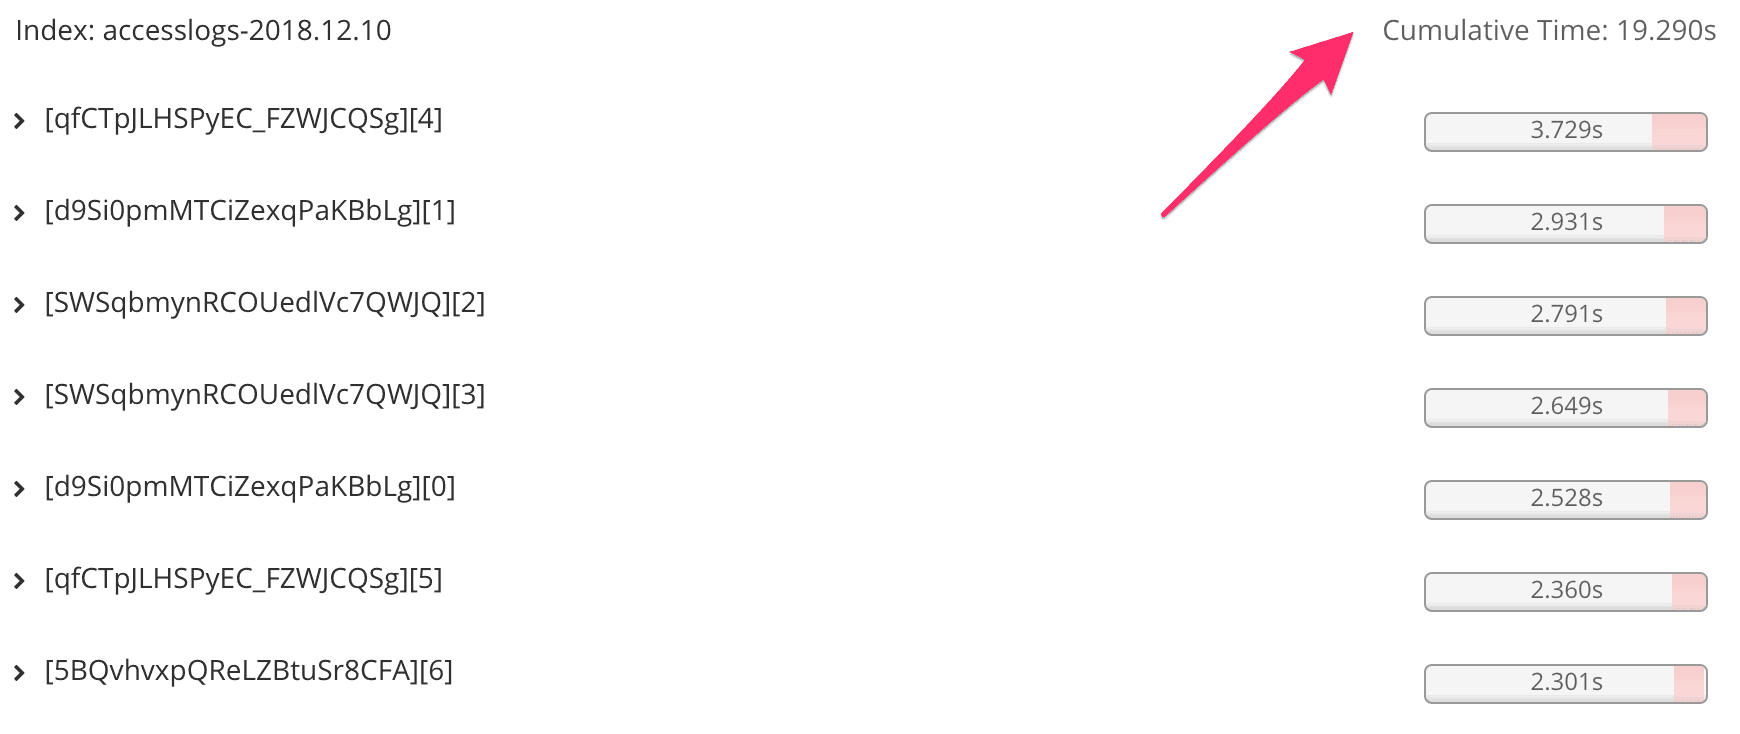
After running the new query through the profiler we can see some improvement:

The difference is even more easy to spot if we remove the
rangefilter. Removing therangefilter forces ES to hit all the documents in the index. This means that the larger the size of the index, the larger the difference between both queries will be.
Elasticsearch aliases
The solution is clear, let’s use filters!. And here is where we hit a wall. At the moment there is no way of specifying query filters for ES in Grafana, there is an open issue that has not been addressed yet.
Elasticsearch supports the use of aliases. This allows having a different name of referencing some index. Think on a pointer to an actual index (very similar to a symbolic link). What is even more powerful is that we can have filtered aliases.
According to the documentation:
Aliases with filters provide an easy way to create different “views” of the same index.
This means that we could create an alias of our index that automatically applies the desired filter (the very long list of hosts). Configure this as a data source in Grafana/Kibana and point our dashboards to use it. With this feature, we can work around the lack of proper filters for Elasticsearch in Grafana.
To create the alias we can fire a POST request against the /_aliases endpoint:
POST /_aliases
{
  "actions": [
    {
      "add": {
        "index": "accesslogs*",
        "alias": "accesslogs-nsi",
        "filter": {
          "bool": {
            "must_not": [
              {
                "terms": {
                  "header.senderId": [
                    "www1",
                    "www2",
                    ...
                  ]
                }
              }
            ]
          }
        }
      }
    }
  ]
}
The end result: after making the switch in the Grafana panels, the loading time for the dashboard went down from ~7s to ~2s.
Additionally, this approach provides some abstraction. Everyone using the created alias will apply the same set of filters. This provides uniformity and also enforces good practices. Our users have now a different “view” of the data (as stated in the ES documentation).
Summary
Index aliases are a very useful technique not only useful for ingesting without downtime, but also to offer different “views” of the same data. As a bonus, they could help to speed some Grafana dashboards 😉.
Bonus Track: Updating the aliases
Since the aliases are set on the index itself we need to update the alias every day (when a new index is created). Using index templates we can do this. The funny thing is that although we think as an alias that points to specific indices, internally is the index the one that knows to which alias (or aliases) it responds to 😀.