Display the application's version in your Grafana dashboards
February 17, 2019 prometheus grafana
At work, we needed a way to monitor the lag of some Kafka consumers reading business-critical topics.
We ended up using this exporter that provided exactly the metrics that we needed. After adding metadata caching to reduce the load on our Kafka cluster we deployed the exporter to our Nomad cluster and started to build dashboards.
While I was making changes to the application. I needed not only to check the logs but also to graph the data that the exporter was getting from Kafka, to make sure that my changes were not breaking the normal behavior. Yes, I love metrics and I create graphs even while writing code 😂.
In Prometheus, if you’re not careful, you can break the continuity of your series if
you use non-identifying labels.
Joining extra info from a separate metric is the preferred way.
The developers of this exporter were kind enough to provide a special metric called
build_info. This metric provides some metadata about the current build as a set
of labels and has a constant value of 1:
# HELP kafka_exporter_build_info A metric with a constant '1' value labeled by version, revision, branch, and goversion from which kafka_exporter was built.
# TYPE kafka_exporter_build_info gauge
kafka_exporter_build_info{
    branch="metadata-cache",
    goversion="go1.11.5",
    revision="b33d679353e0a1f7b521c7d6d4461e33913b9efe",
    version="1.2.0"
} 1
The idea of exposing the software version to prometheus is not new. And in fact, it is a common practice among Prometheus exporters.
The difference is that in this case, I didn’t want to “join” my metrics with the build data. I just wanted to show the build info in a useful way in Grafana. That’s why I didn’t use the this approach.
Grafana
Grafana supports visualizing several queries in the
same Panel. So I only needed to show the kafka_exporter_build_info as a new
metric and make it visible in some way.
I ended up using the following query:
kafka_exporter_build_info-1
Because the kafka_exporter_build_info has a constant value of 1 and only
the labels are changing. The value of this query is always going to be 0.
⚠️ I didn’t have several versions of the same software running.
The visualization
After this I configured the metric’s Legend format to be: build {{ revision}}.
revision is the git commit hash at build time of the deployed binary.
All the series generated by this metric are going to start with the build
prefix.
Now, I only needed to override how this specific series was shown in my panel. Grafana supports series overrides, meaning changing certain aspects of a series while keeping the rest of the styles untouched.
Using this feature we can add an override for all series that start with the
build prefix using the /build.*/ regex. And then change some settings,
like:
- Line: true (always show a line for this series)
- Line width: 6 (let’s use a thick line)
- Points: false (never show any points)

Setting these options allows us to change the rest of the panel display settings disregarding how it will affect the build series.
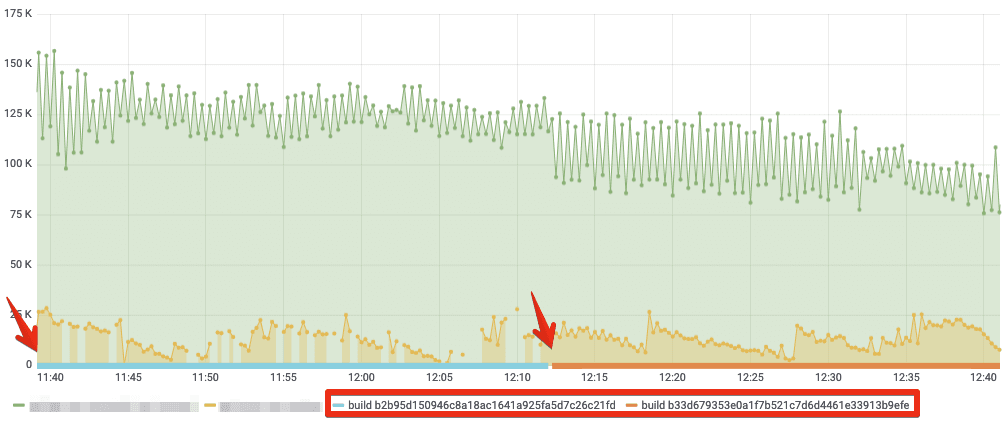
The end result looks like this:

As a bonus, you can see how the last deployed version fixed some issues with missing metrics
Summary
A thick line at the 0 value of the graph always shows the version that I’m
using. It is visible in the legend and a change in the color indicates that
a new version has been deployed.
The change in the color provides nice visual feedback when a new version is deployed. And yet, it is not intrusive to whatever you’re showing in your graph. It is self-contained, you can change the appearance of your graph without affecting this particular series. Finally, this approach doesn’t require that your queries are “aware” of the build information.