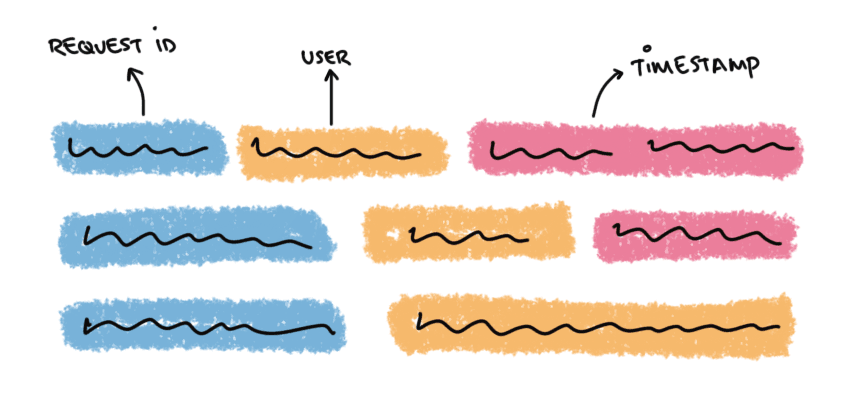
Web UI for testing dissect patterns
February 21, 2020 filebeat dissect test ui

If you have been using Filebeat to ship your logs around (usually to Elasticsearch) you know that Filebeat doesn’t support Grok patterns (like Logstash does). Instead, Filebeat advocates the usage of the dissect processor.
A small CLI tool for local pattern testing is also available now. Releases are available in the
Github Releases page. After downloading and
decompressing the .tar.gz file the CLI can be executed as:
$ dissect-tester/dissect-tester --pattern='%{key1} %{key2}'
Test cases are accepted through stdin and for each test case the result will be sent directly into
stdout.
I like the dissect processor tokenization syntax. It is easy to understand and usually quite fast at processing. This blog post is not about the decision of not supporting Grok patterns in Filebeat.
If you work with Logstash (and use the grok filter). You might be used to work with tools like regex101.com to tweak your regex and verify that it matches your log lines. Beyond the regex there are similar tools focused on Grok patterns:
These tools make it quite simple to just paste your pattern, a few log lines and verify that everything is working as expected. I was missing something similar for the dissect processor syntax.
I hear you: The syntax of the dissect processor is simpler than the regex format supported by the Grok filter. I dont' disagree: If you check the example from the dissect processor documentation:
processors:
  - dissect:
      tokenizer: "%{key1} %{key2}"
      field: "message"
      target_prefix: "dissect"
It is quite easy to understand that the tokenizer is looking for 2 keys separated by a space. It is
less obvious that if we pass a string with multiple spaces (like a b c) key2 will have the value
b c.
Let’s see another example. If your logs are a bit more complicated (let’s say like the Envoy access log format). You might endup having a tokenizer like:
[%{timestamp}] "%{request}" %{status} - %{bytes_sent} "%{forwarded_ips}"
"%{user_agent}" "%{unknown_id}" "%{destination_host}" "%{destination_address}"
with a log entry like:
[2020-02-21T14:29:08.671Z] "GET /stats?format=prometheus&usedonly=1 HTTP/1.1"
200 - 0 105150 6 - "10.22.10.103" "Prometheus/2.7.0" "-" "10.22.10.121:12345" "-"
That mix of quoted values makes it a bit harder to mentally parse the line, right?
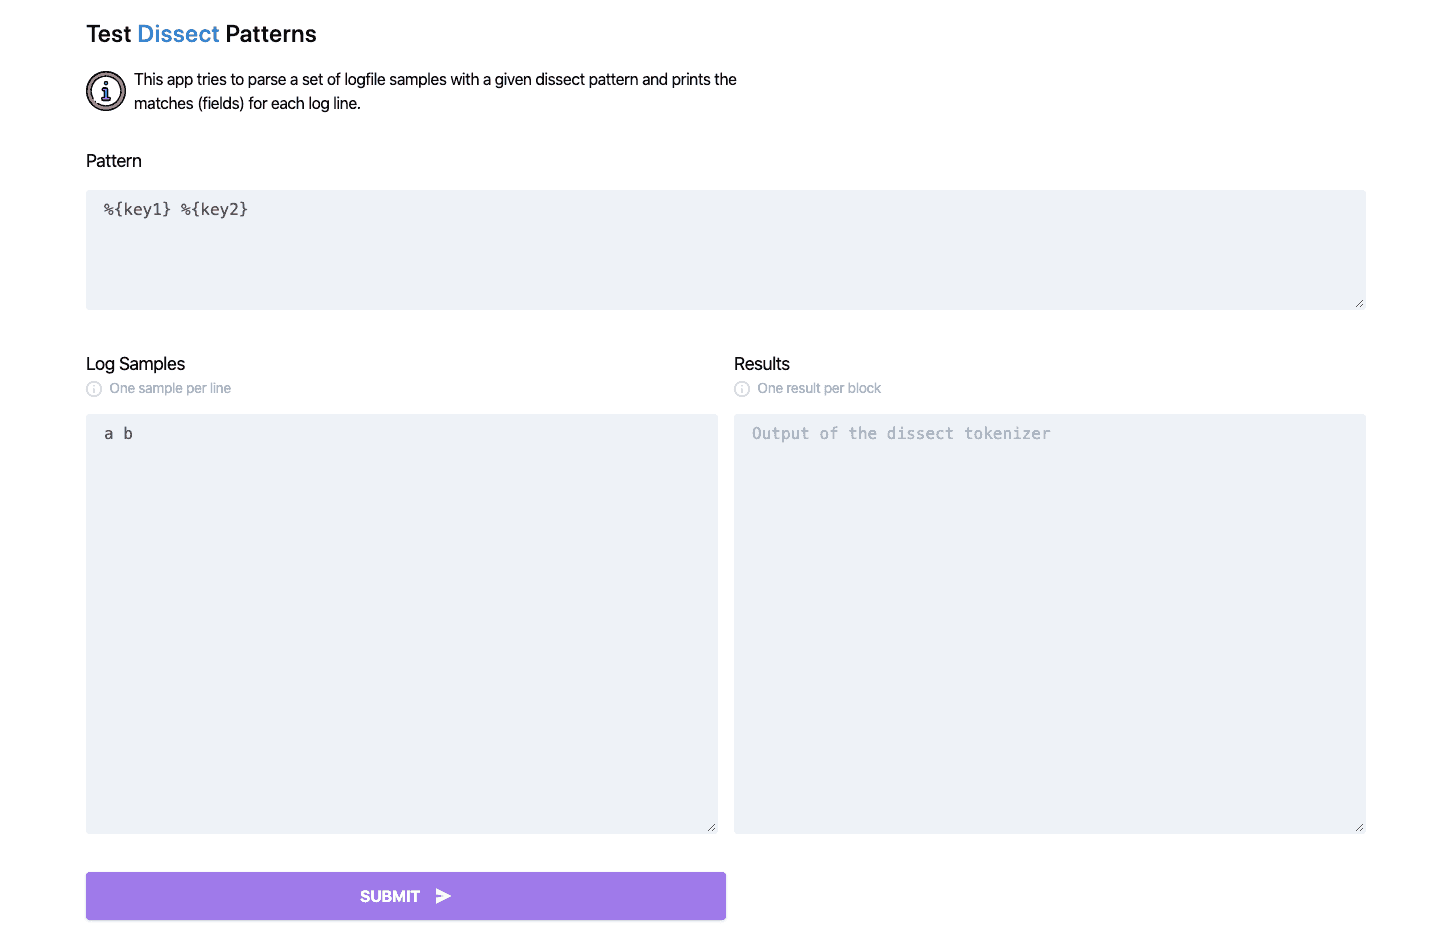
That’s why I built a small Web UI like Grok Debugger. Available 🚀 here where you only need to put your pattern, a few samples (one per line) and see the output on the result area. That’s it!

Final thoughts
The source code for the app is available on Github. The app uses the latest version of the Filebeat dissect processor (currently v7.6.0).
You can play with the demo in https://dissect-tester.jorgelbg.me
Both Elasticsearch and Logstash also have dissect filters/plugins. You should be able to use this tool for testing patterns for those implementations as well, but keep in mind that we’re using the Filebeat implementation under the hood.