Displaying geohash tags from a Loki datasource in a Grafana Worldmap Panel
March 18, 2020 grafana loki worldmap geohash
🚧 Loki v2.x
Loki v2.0 included a new set of features to the query language that allows extraction of labels at query time, unlocking new possibilities. This means that previously we would need to have the
geohashinformation as a label (which is not a great idea). Loki works best when you have a small set of labels (with no high cardinality). Ageohashfield is a very bad candidate for a label 🙃, in our defense before Loki v2.0 this was the only way of using thegeohashin the worldmap plugin.With the new Parser expressions we can extract labels (at query time) and used them as normal labels in our queries. For instance, instead of using the old:
sum(count_over_time({geohash=~".+"}[1h])) by (geohash)which expects the geo information in a
geohashlabel. We can instead use the| logfmtparser expression to extract thegeohashinformation from the payload into a label at query time.sum(count_over_time({domain=~"jorgelbg.me"} | logfmt [5m])) by (geohash)This has the advantage of not polluting our set of identifiable labels and helping to keep Loki queries as fast as possible.
Note: Beside the
| logfmtparser it is also possible to use the| jsonone if the payload sent to Loki is in the JSON format.
Loki is a new~ish project from Grafana, yes the same company behind the popular open-source observability platform. Loki itself is a horizontally-scalable, highly-available, multi-tenant log aggregation system inspired by Prometheus.
On fewer words, Loki is like Prometheus but for your logs. This means that although it doesn’t provide all the full-text search capabilities of Elasticsearch, it allows filtering by a set of labels for each log stream. This translates into a more cost-effective solution.
Loki was announced on KubeCon 18'. and it is still under active development. As expected the team is building in parallel the internal Loki components: ingestion, storage, and query layer and the visualization UI (Grafana). It was not until recently that I’ve started to play with Loki. My main experience is about running large Solr and/or Elasticsearch clusters, but I was looking for something a bit easier and cheaper to host by myself. After all, I was not interested in all the features offered by the ELK stack.
My data consist of a few labels and perhaps an optional message. I am more interested in the labels
tho. Some of those labels contained the latitude (lat), longitude (long) and geohash
(geohash) of a given location. A geohash is a popular
public domain geocoding system invented in 2008 by Gustavo Niemeyer which encodes a geographic
location into a short string of letters and digits. My event also included some descriptive
information like place (city) and country.
I wanted to plot this data into a map using the Worldmap
Panel. Yet, it was a bit of
a bumpy road. I was already running a container with the latest version of Grafana since I was using
the Explore UI from Grafana with the Loki datasource to check the incoming data. Adding the
grafana-worldmap-panel plugin can be done by definiting the GF_INSTALL_PLUGINS environment
variable while running the container:
$ docker run -d -p 3000:3000 -e "GF_INSTALL_PLUGINS=grafana-worldmap-panel" grafana/grafana
My initial thought was to point the Worldmap Panel to the Loki datasource and run one of the LogQL queries. The query ended up looking like:
sum(count_over_time({geohash=~".+"}[1h])) by (geohash,lat,long,country,place)
This didn’t work. Using the query inspector from Grafana I noticed that the response payload from Loki was almost identical to the output of a Prometheus query. The next step was to try and replicate the setup explained in this post.
Trying to show the data setting the Location Data as a geohash yielded this error:
Error: Missing geohash value
Which made a bit of sense, since we need to set the {{ geohash }} as the legend of our query. This
makes the geohash label (when using a Prometheus datasource) available to the Worldmap panel. Since
the legend input is missing when using the Loki datasource it is not possible to configure it like this.
I also tried to use the Location Data (i.e lat and long) as a table, which ended up looking
like:
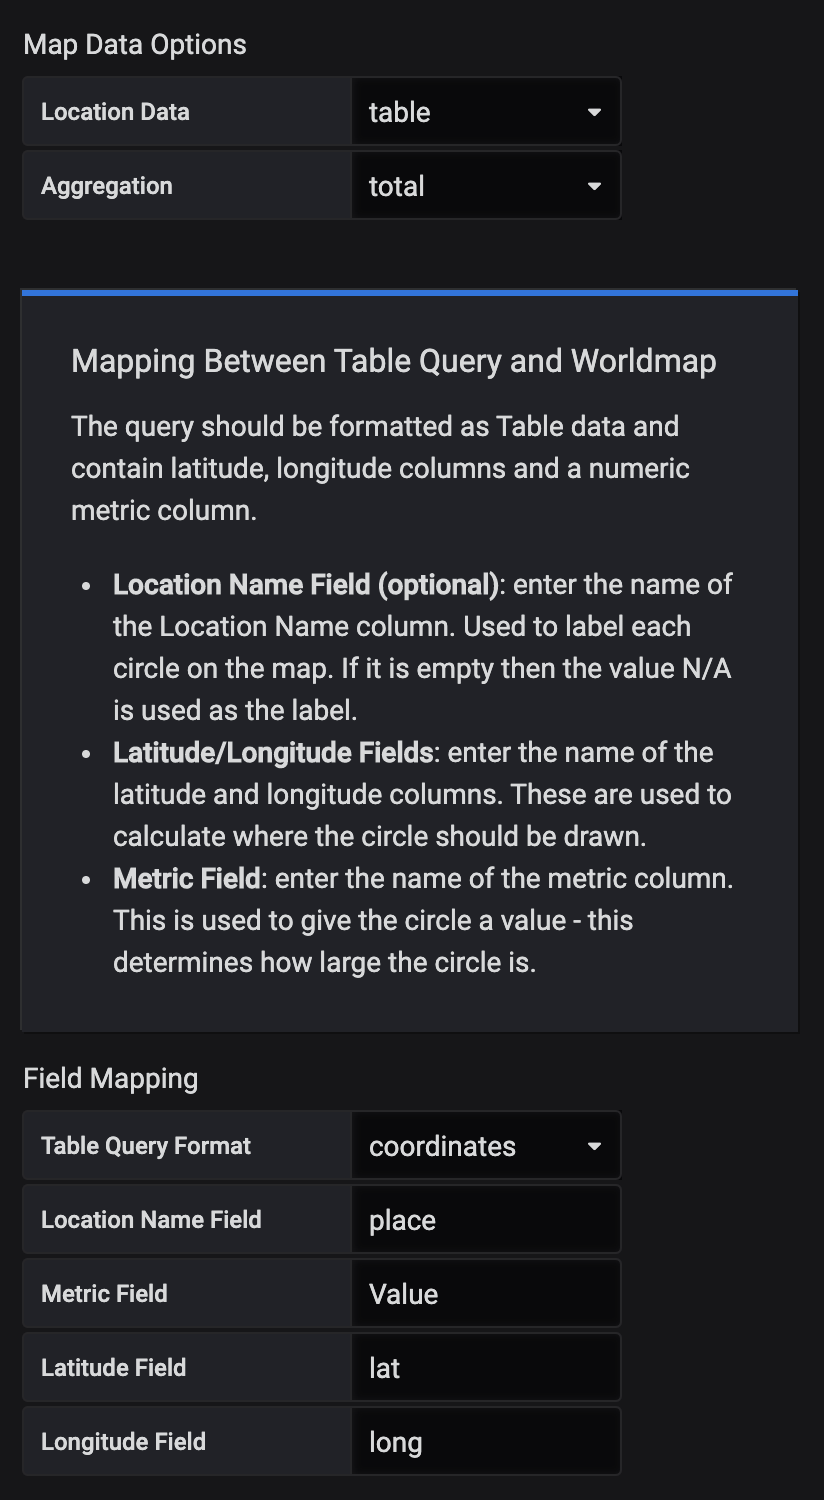
Although this setup didn’t produce any errors it didn’t visualize anything on the map either 🤷♂️. The missing piece of the puzzle is that we can configure the Loki datasource as a Prometheus datasource in Grafana 🤯.
To do this we need to create a Prometheus datasource in Grafana but point it out to the Loki endpoint:
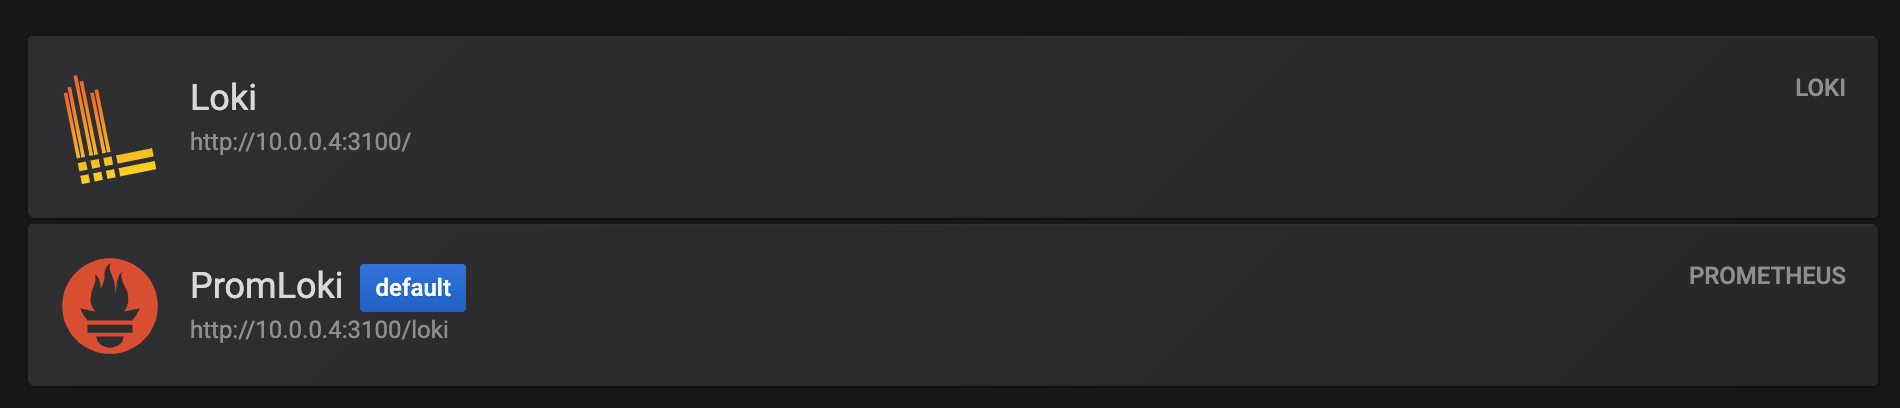
As you can see we use the same URL as before, but we need to add the /loki path to the Prometheus
datasource.
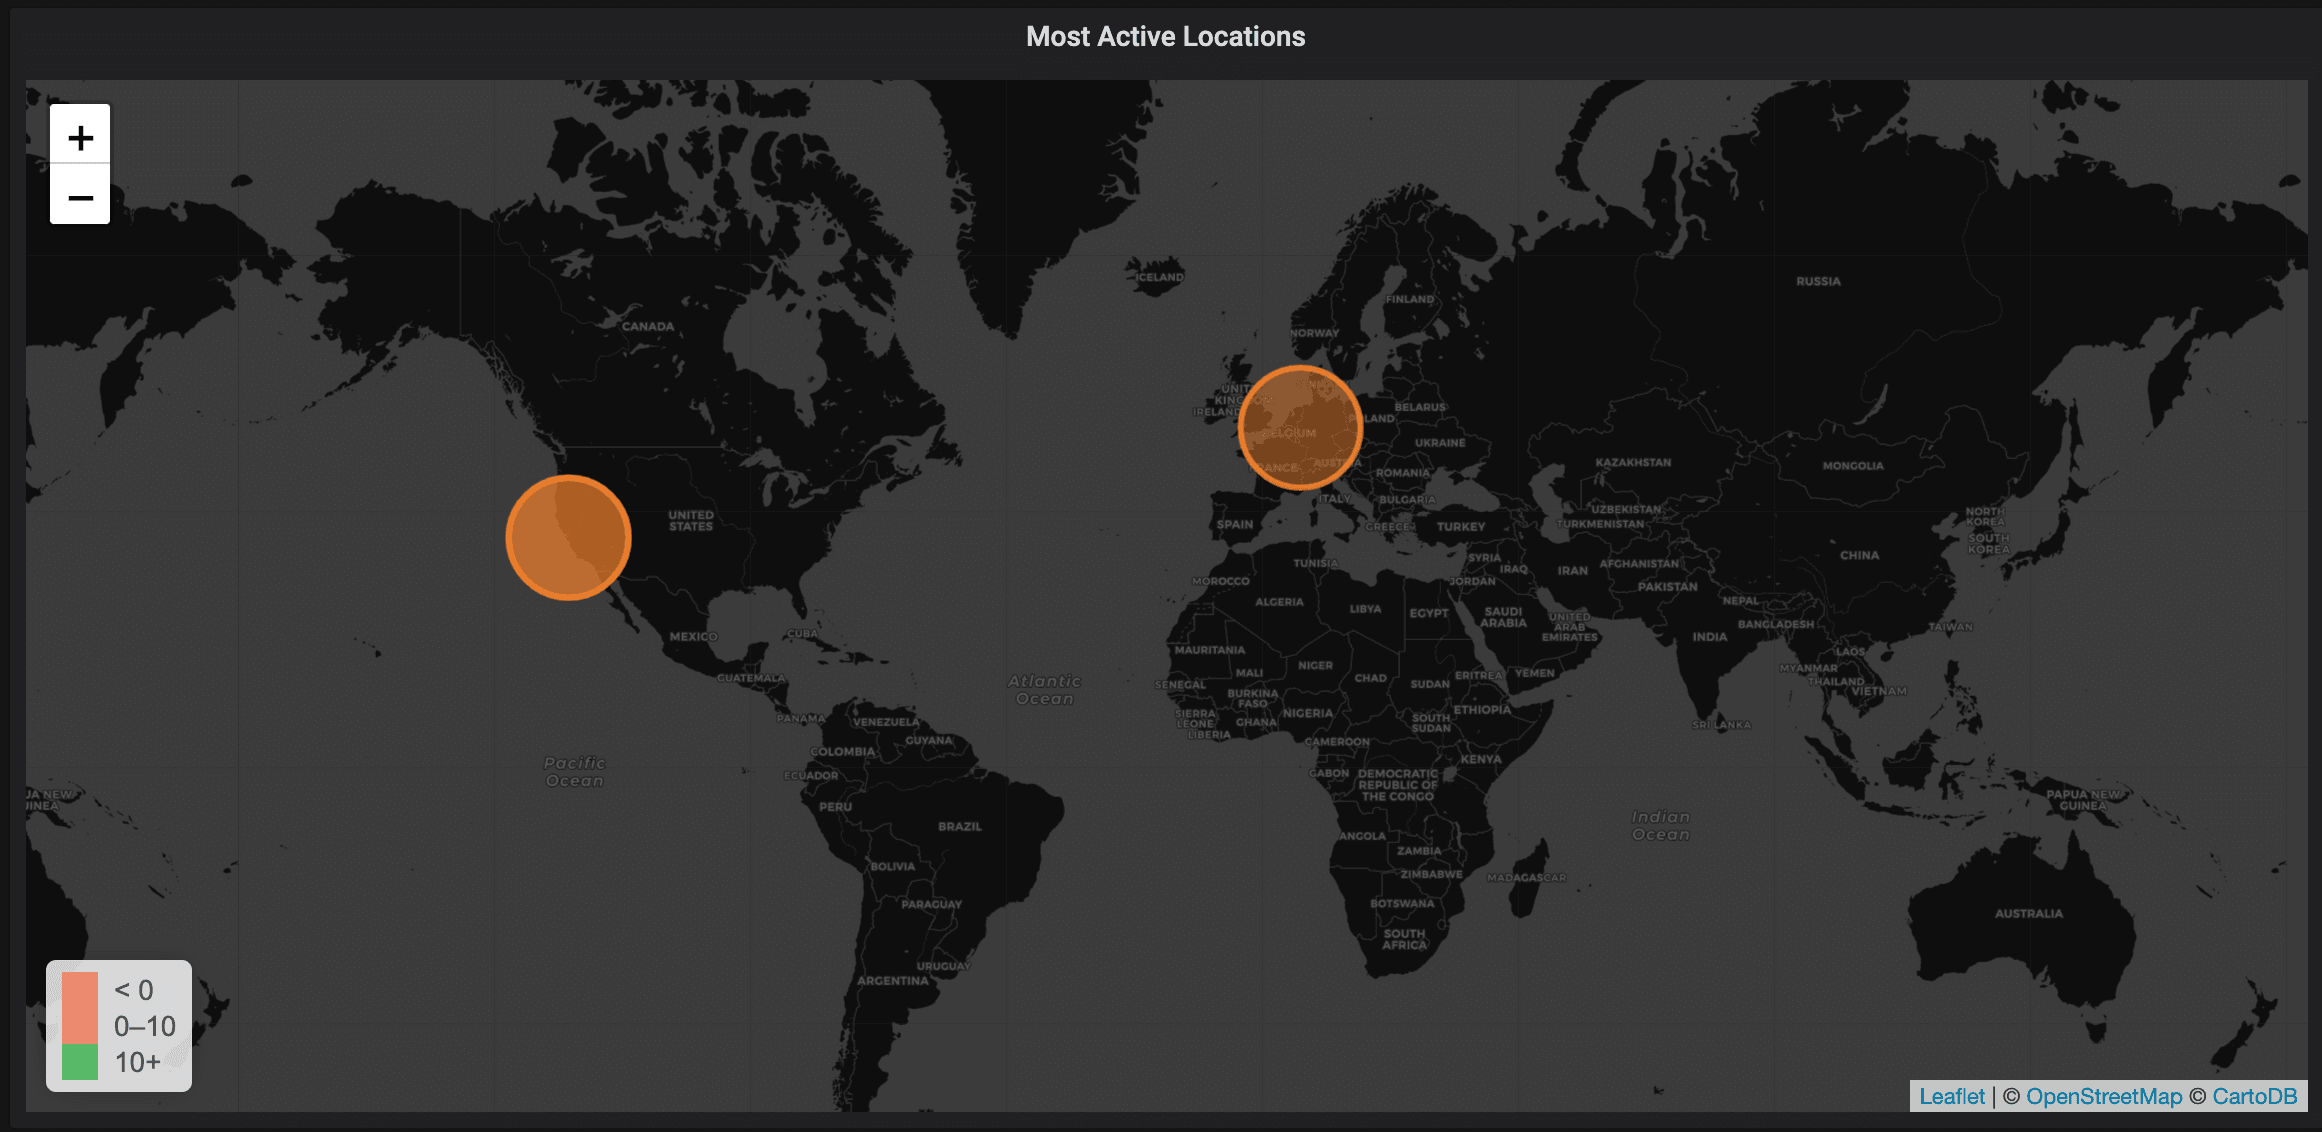
Using Loki as a Prometheus datasources allows us to use the same query as before, but have access to the configuration options only available to a Prometheus datasource. We can now follow the instructions in the mentioned post to visualize the labels stored in a Loki datasource in the Worldmap panel.
The end result looks like:
Summary
TL;DR you can configure a Loki datasource as a Prometheus datasource in Grafana, this will give us access to the same bells and whistles of a normal Prometheus server. Keep in mind that LogQL, the query language implemented by Loki, is a subset of PromQL, which means that not all functions, aggregations or operators will be available.
This step of configuring Loki as a Prometheus datasource is mandatory (at least for Grafana v6.6.2, latest stable release at the time of publishing this post) to get the Worldmap Panel plugin playing nicely with your Loki datasource(s). I imagine that in the no so far future Loki support in Grafana will improve making things like using a 3rd party plugin easier.